Monitoring
Error Report
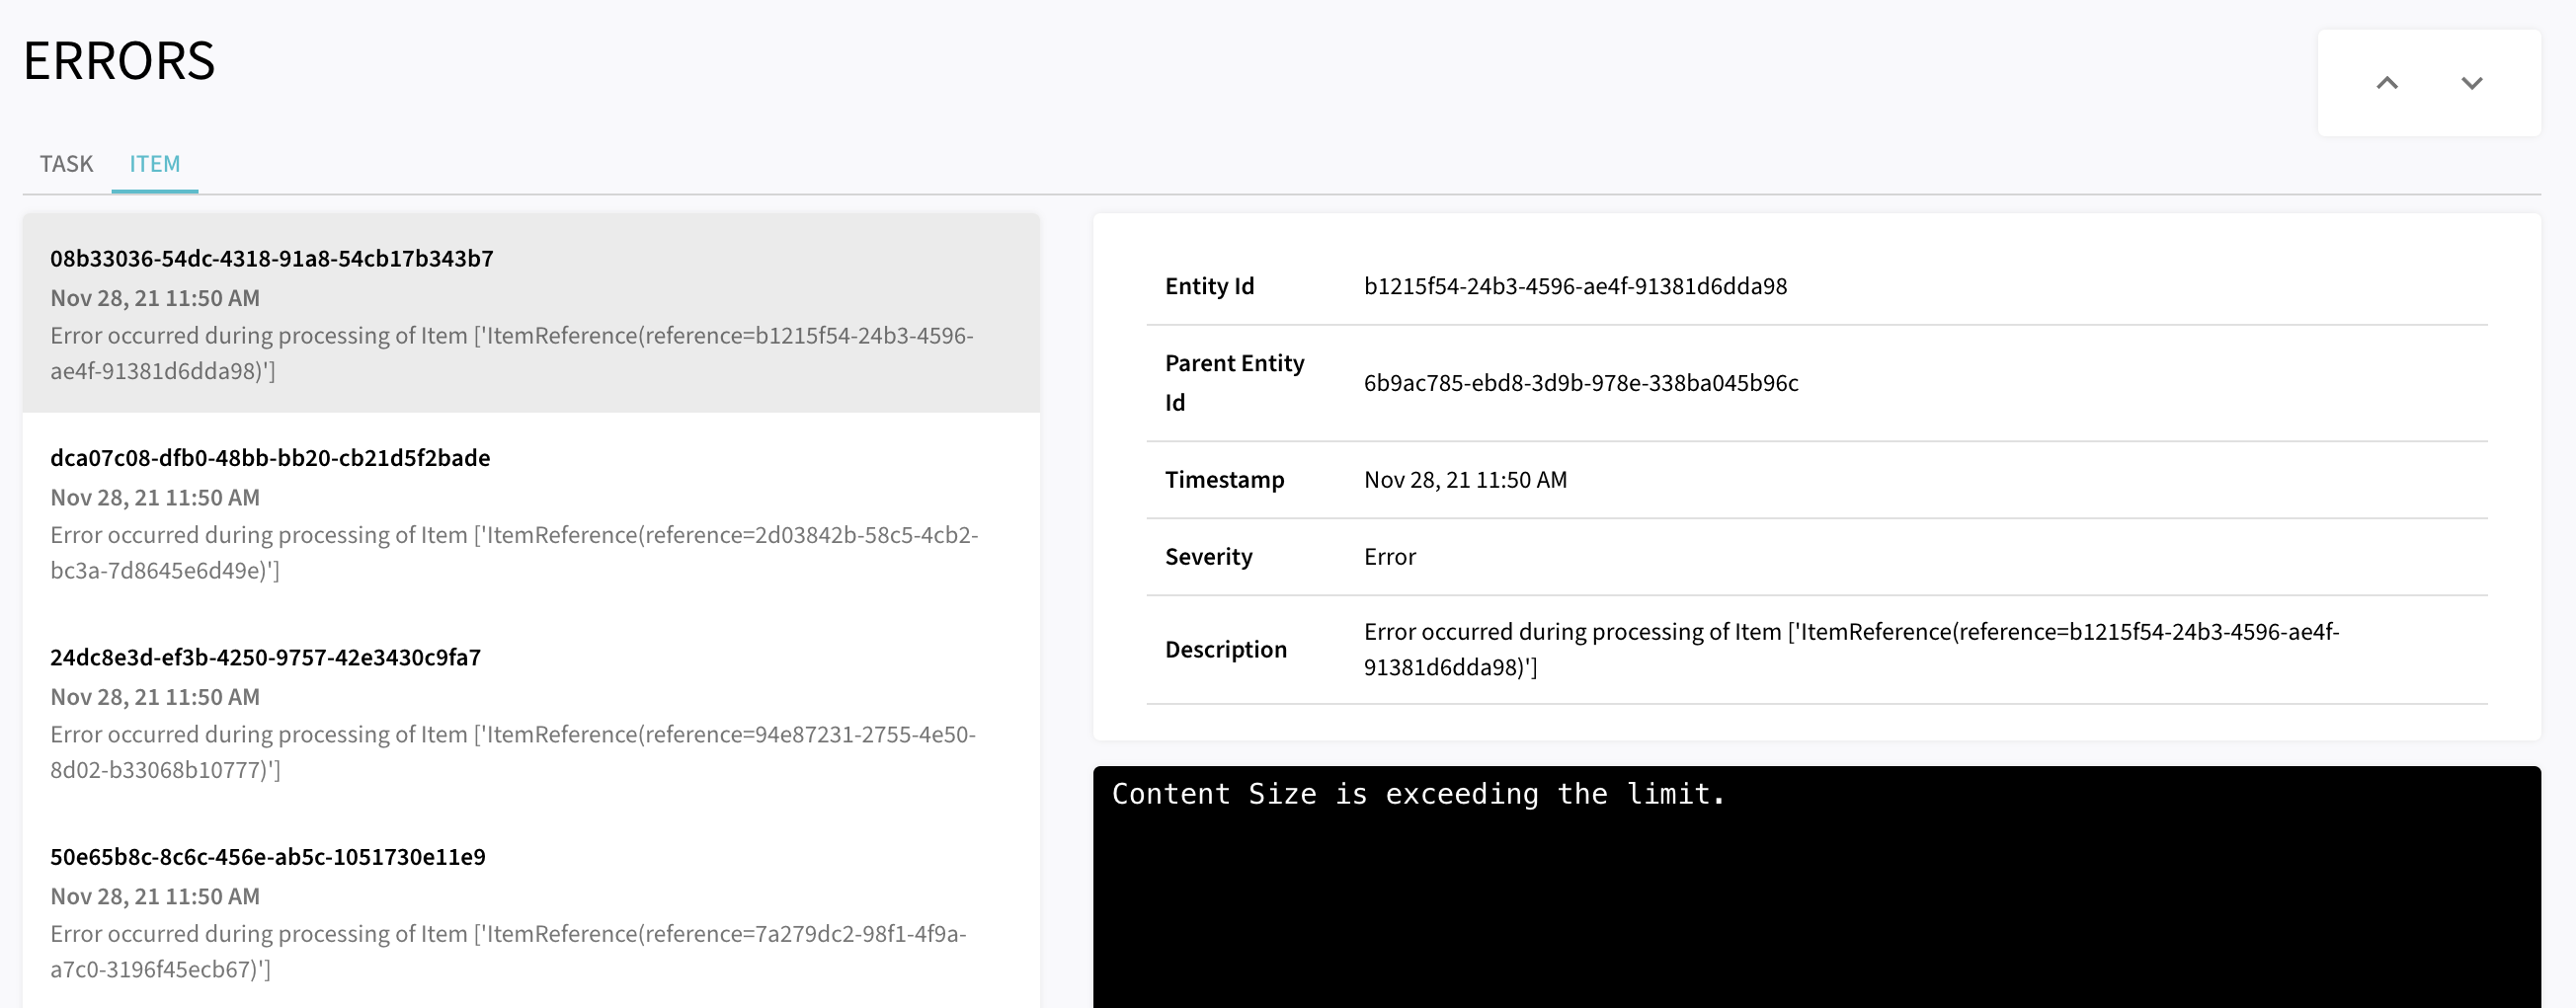
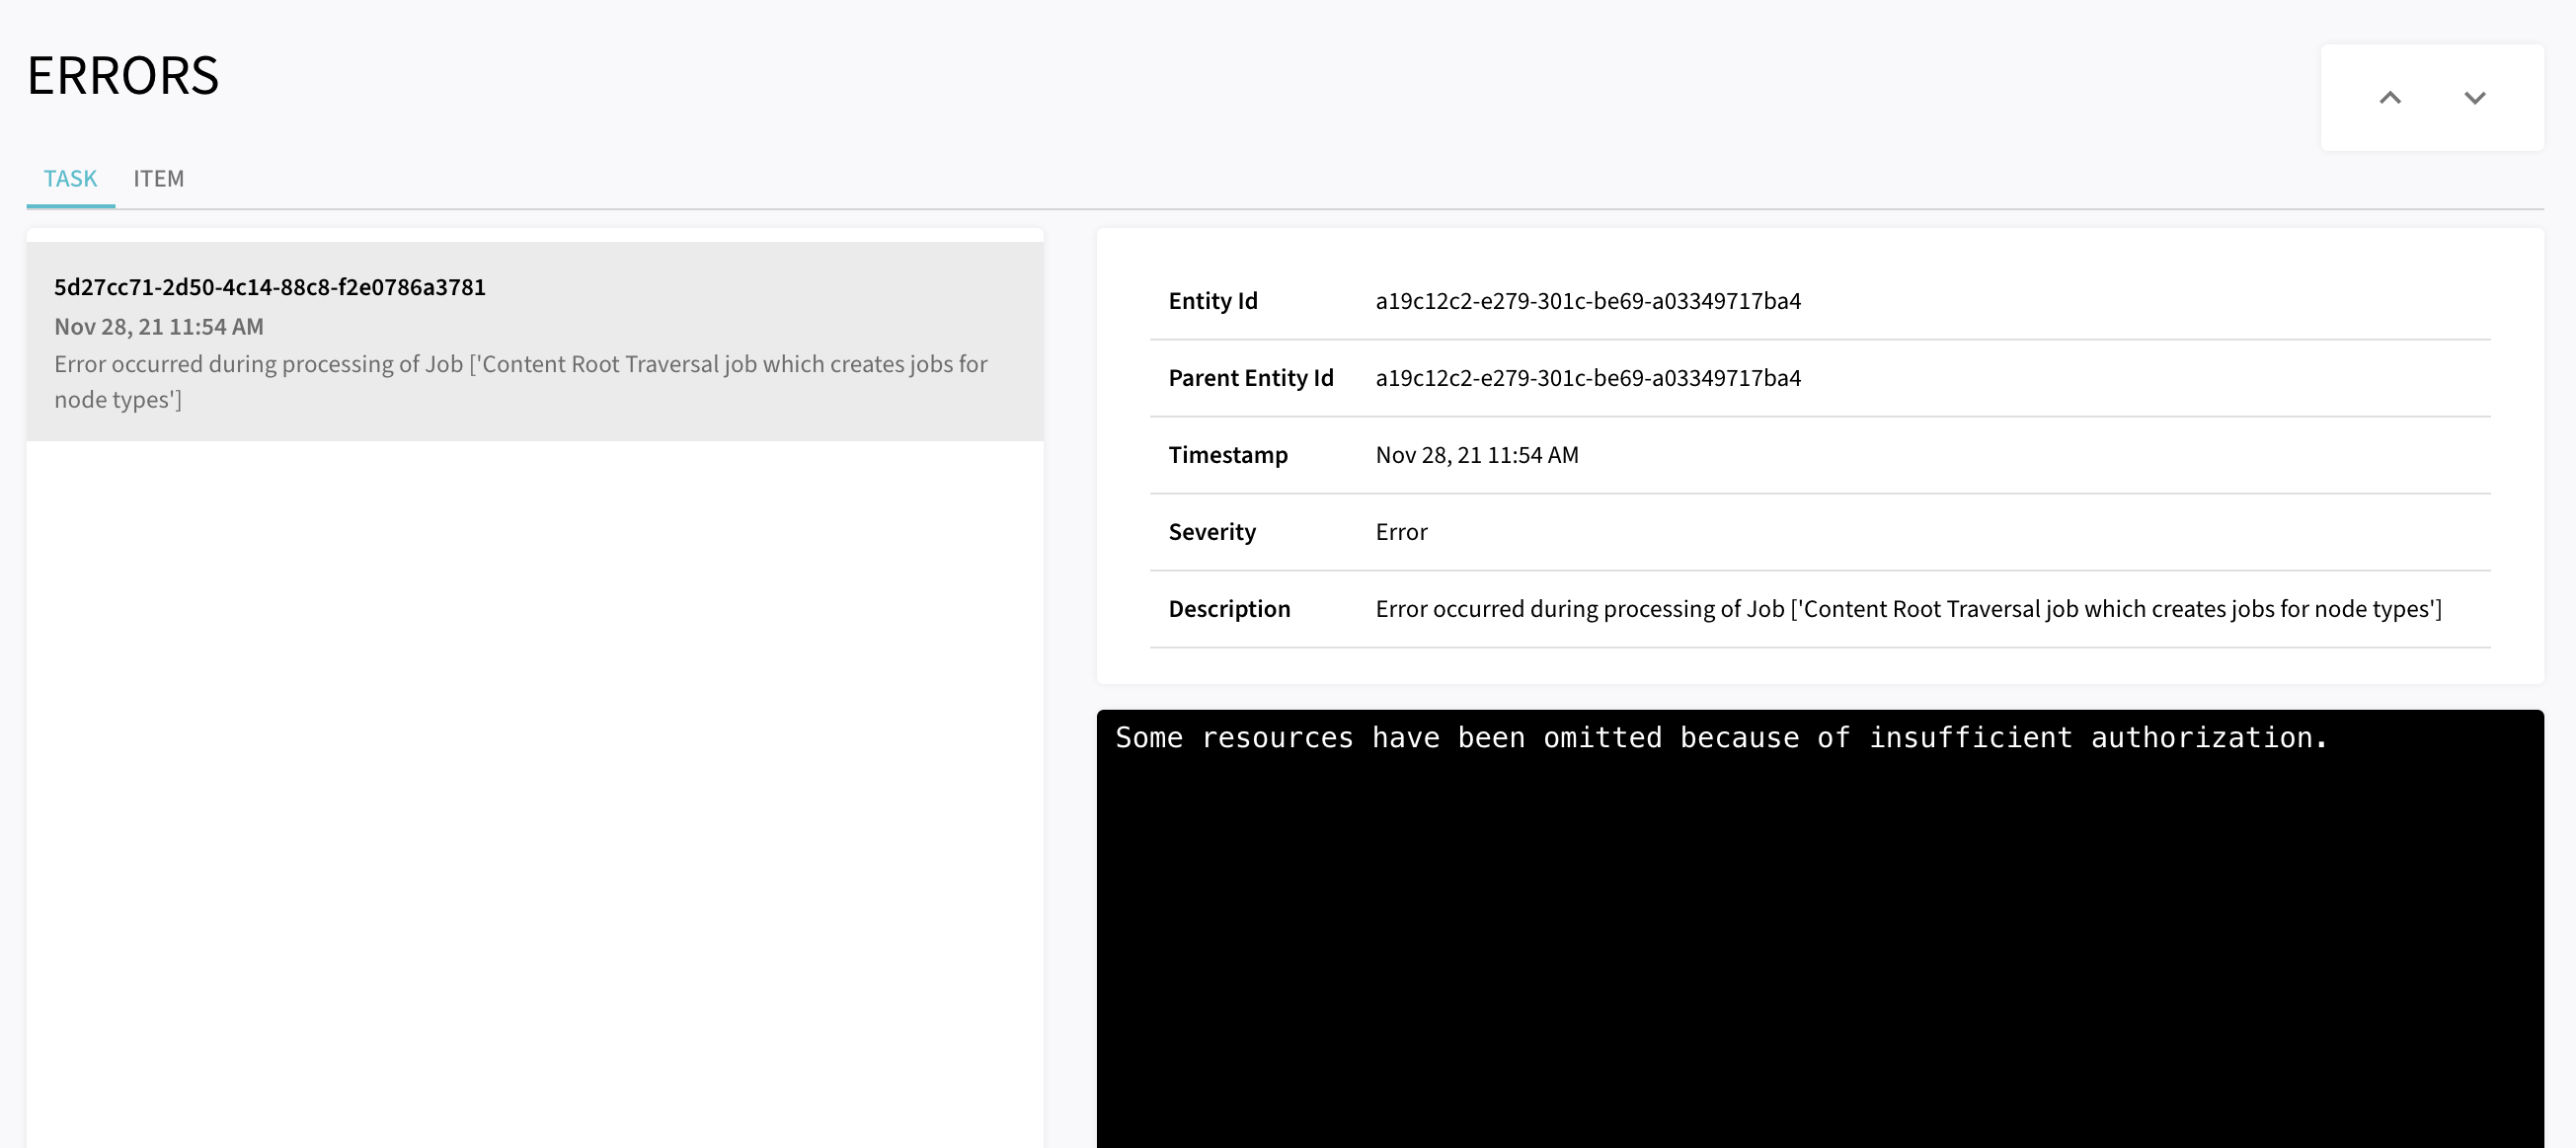
Errors occurred during synchronization can be inspected in the History menu.
Click on Show Errors to inspect the errors during synchronization.

The errors are categorized into task and item-level errors. Each item-level error associates exactly a single item, while a task-level error associates a dynamic subset of items within the source system which could not be processed by the connector.
Logging
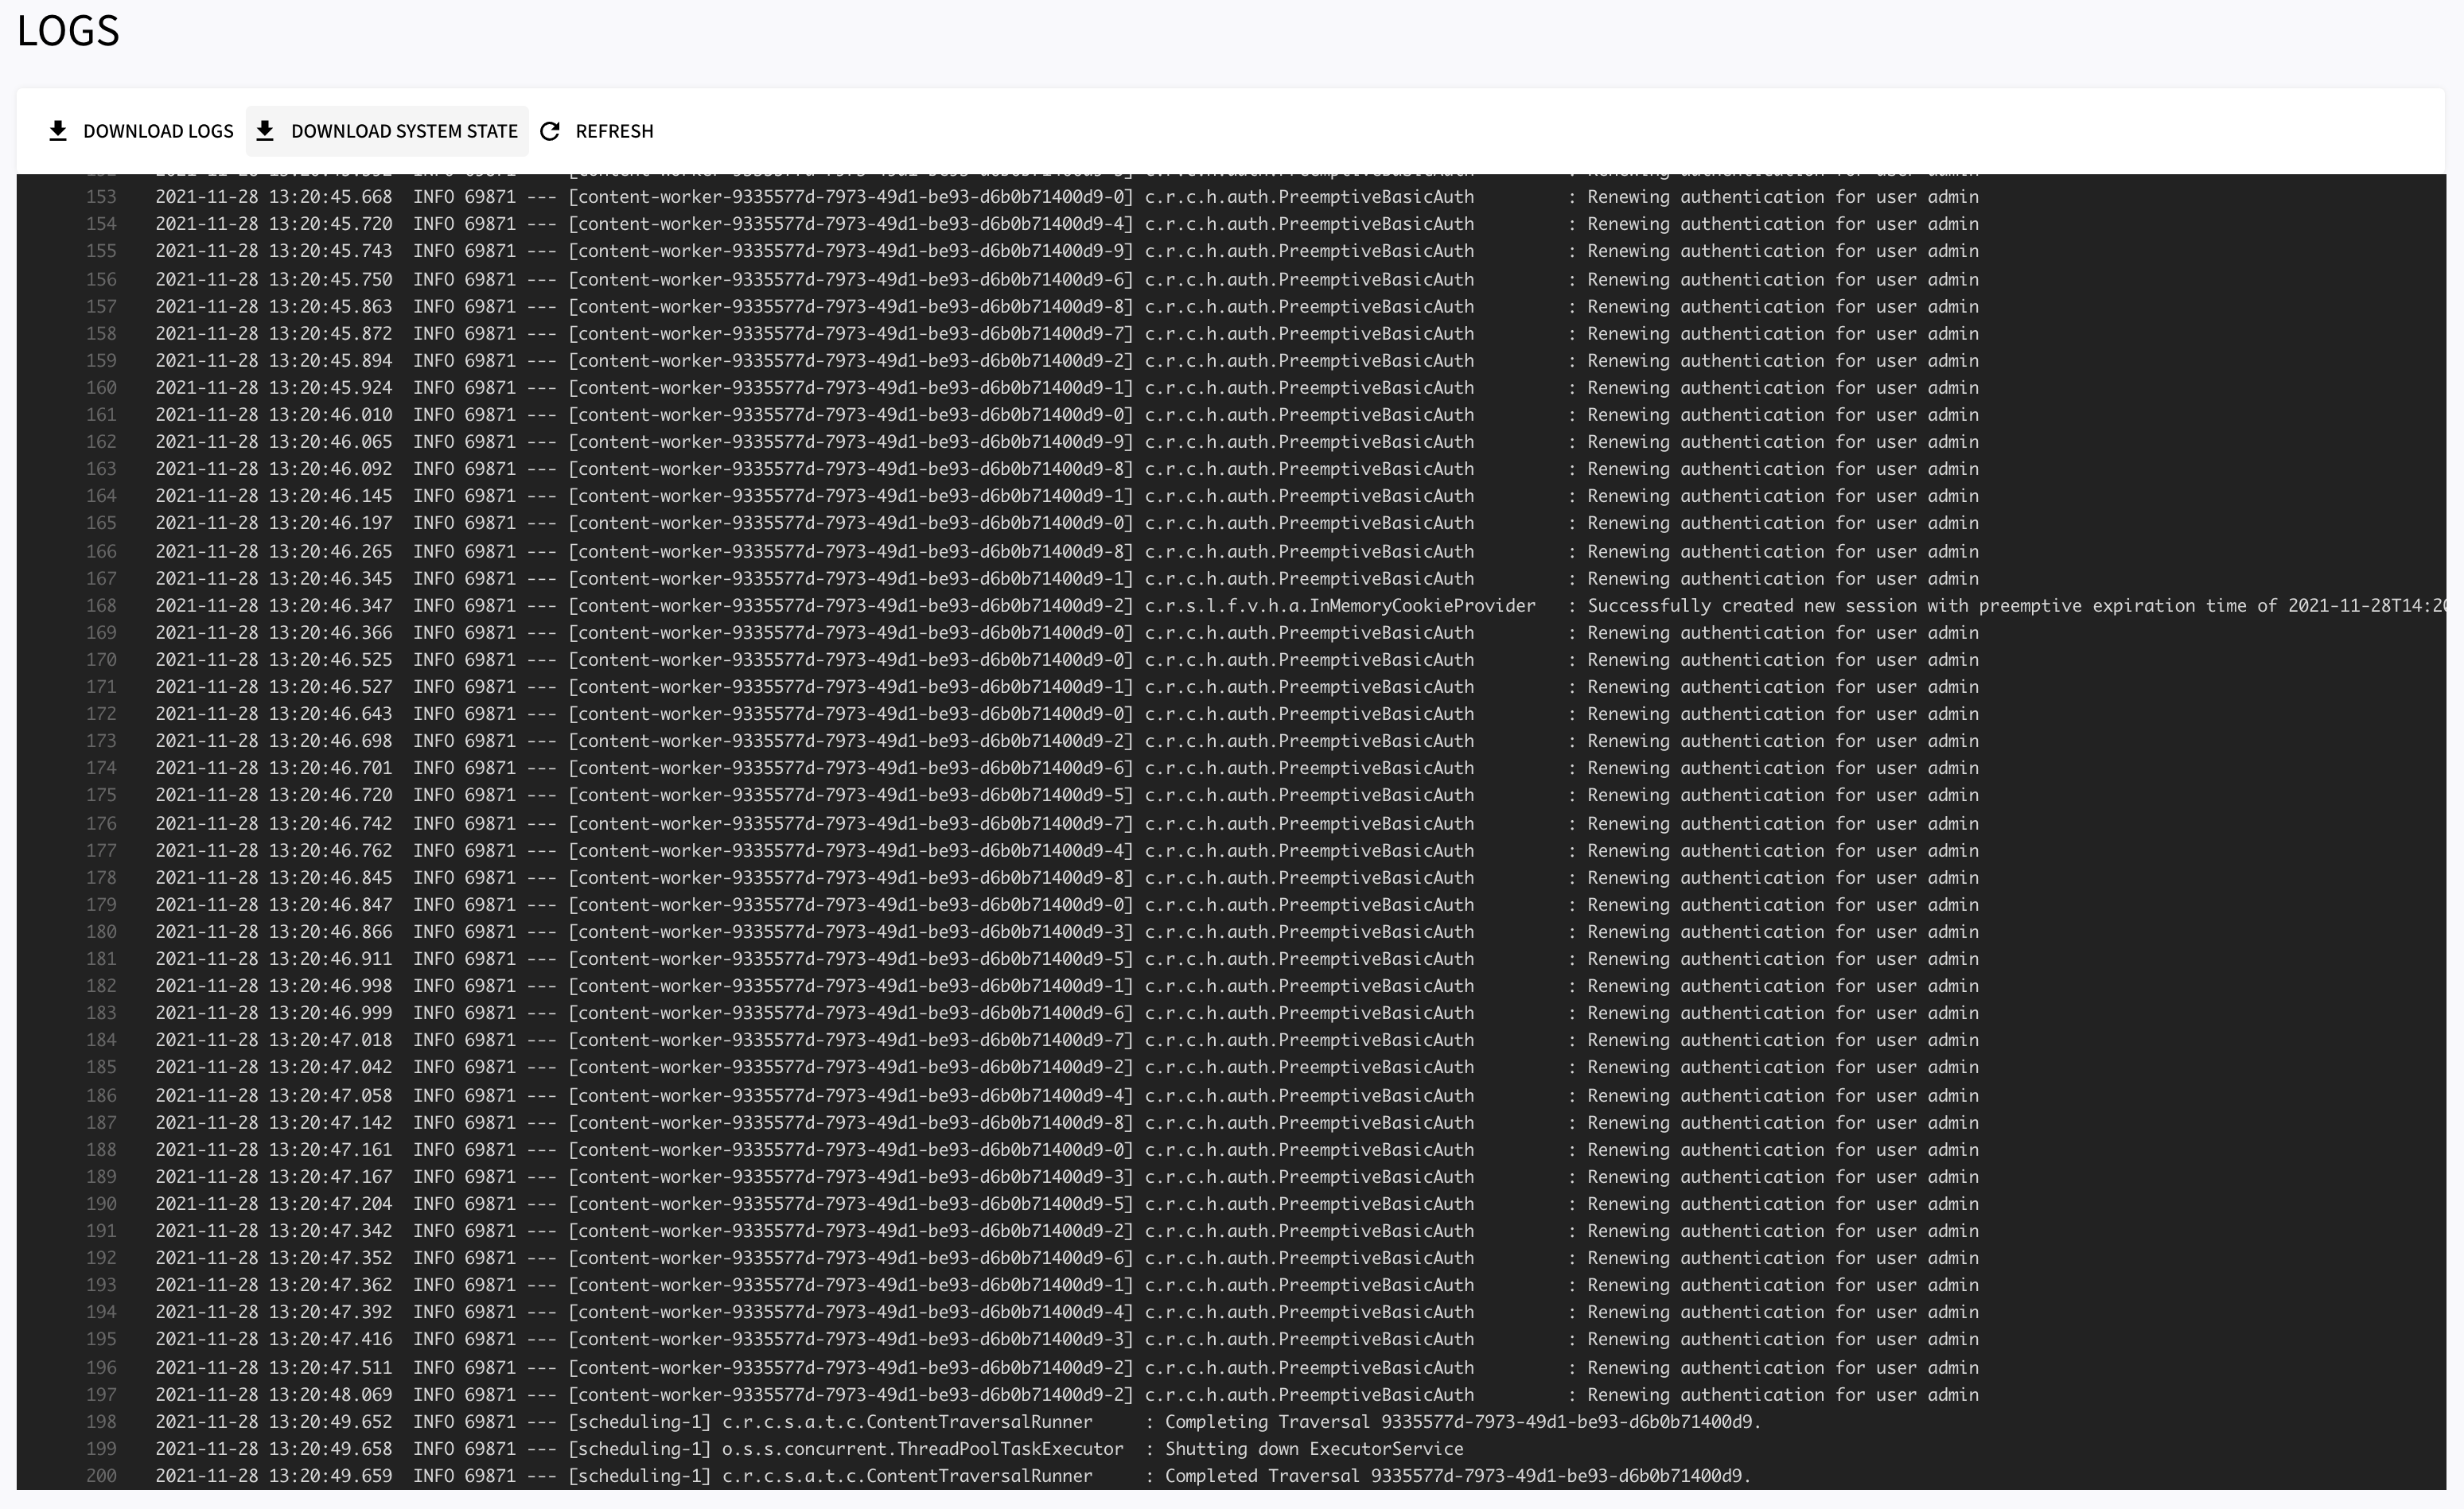
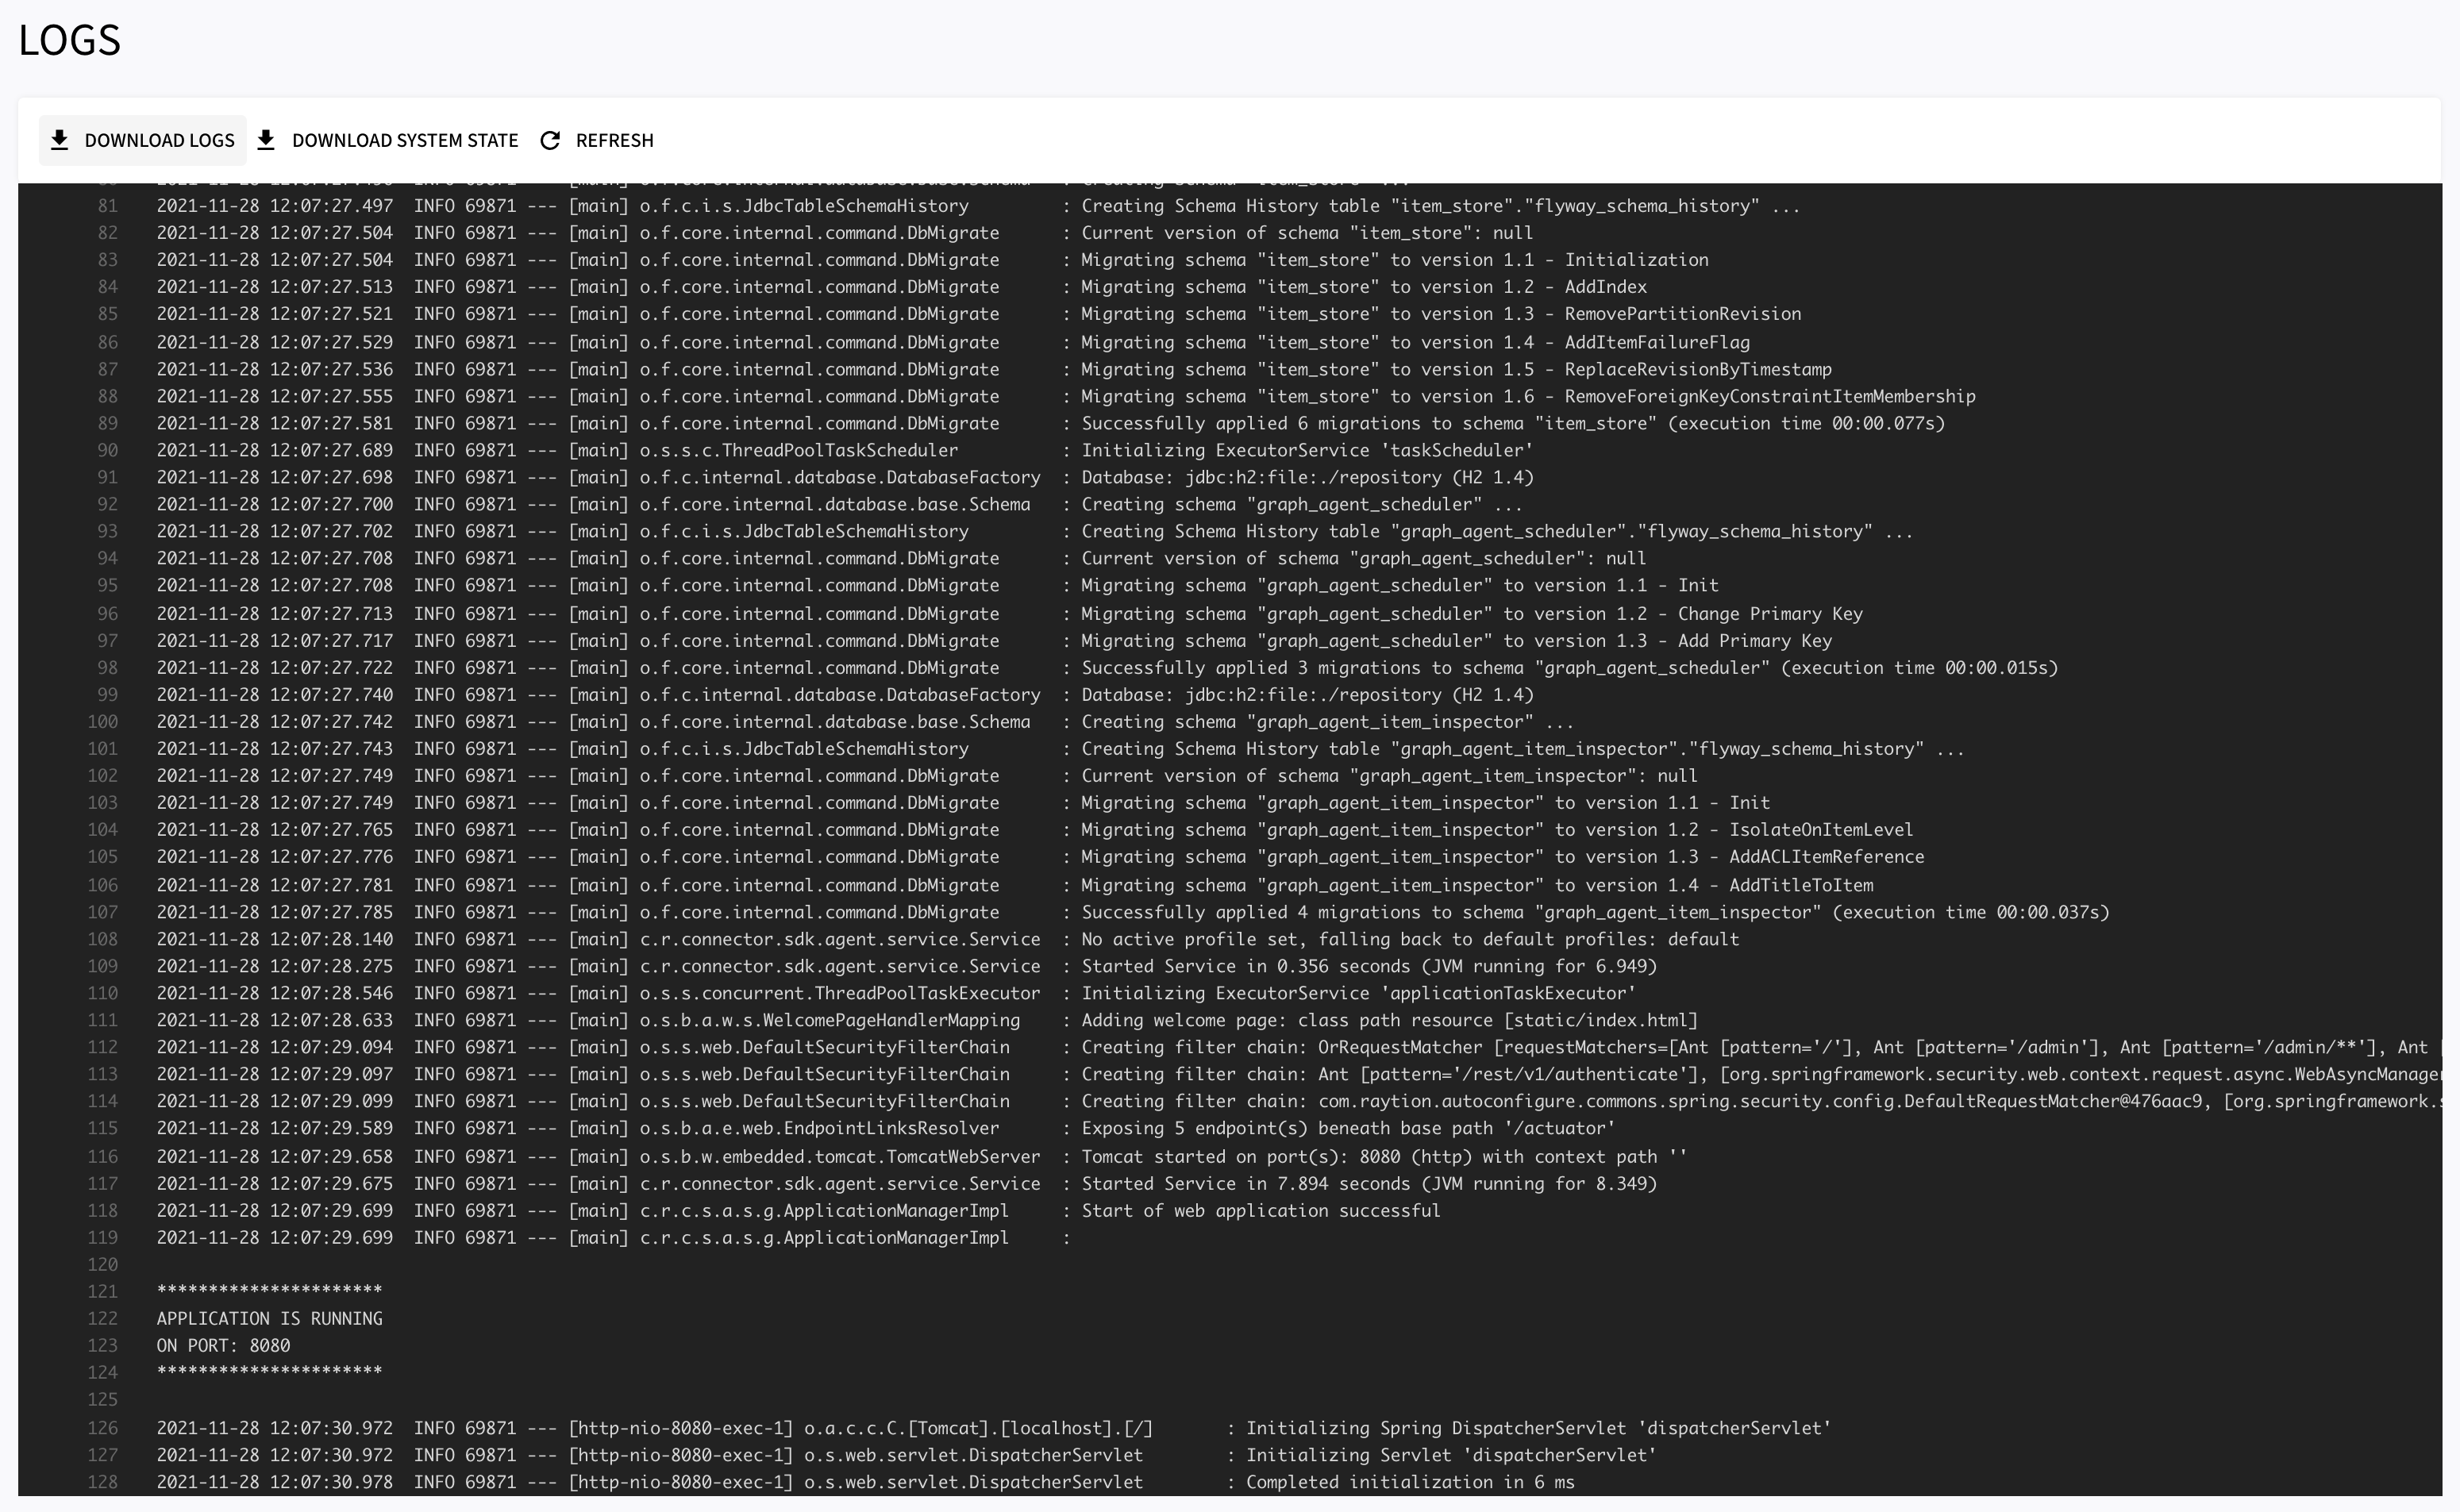
From the configuration validation on the Configuration page and the error reporting on the History page the Admin UI should provide sufficient information to understand the state of your connector. But, to get more insight into system state, you can inspect the System Log in the Log Viewer in the Admin UI.
The logs can be also downloaded from the UI to share it with our Support Team.
The logs can be retrieved and downloaded from the Logs menu.
For downloading the logs, click on DOWNLOAD LOGS.
Metrics
The Connector provides metrics which can be natively pulled by Prometheus. The current snapshot of the metrics can be downloaded
together with the System State, but to monitor the connector continuously and aggregate the metrics, we recommend
to deploy your own Prometheus instance.
To retrieve the list of available metrics, invoke the REST endpoint /actuator/metrics:
{
  "names": [
    "broker_channels_delete_duration",
    "broker_channels_deletes",
    "connector.traversal.items.backend.add",
    "connector.traversal.items.backend.delete",
    "connector.traversal.items.changed",
    "connector.traversal.items.children",
    "connector.traversal.items.create",
    "connector.traversal.items.delete",
    "connector.traversal.items.fail",
    "connector.traversal.items.getStatus",
    "connector.traversal.items.new",
    "connector.traversal.items.orphan",
    "connector.traversal.items.pipeline.process",
    "connector.traversal.items.put",
    "connector.traversal.items.unchanged",
    "connector.traversal.items.unseen",
    "connector.traversal.jobs.complete",
    "connector.traversal.jobs.fail",
    "connector.traversal.jobs.poll",
    "connector.traversal.jobs.put",
    "connector.traversal.nodes.content.process",
    "connector.traversal.partitions.children",
    "connector.traversal.partitions.delete",
    "connector.traversal.partitions.orphan",
    "connector.traversal.partitions.orphan.delete",
    "connector.traversal.partitions.put",
    "connector.traversal.partitions.unseen",
    "connector.traversal.workers.blocked",
    "connector.traversal.workers.lifetime",
    "connector.traversal.workers.new",
    "connector.traversal.workers.runnable",
    "connector.traversal.workers.terminated",
    "connector.traversal.workers.timed_waiting",
    "connector.traversal.workers.waiting",
    "hikaricp.connections",
    "hikaricp.connections.acquire",
    "hikaricp.connections.active",
    "hikaricp.connections.creation",
    "hikaricp.connections.idle",
    "hikaricp.connections.max",
    "hikaricp.connections.min",
    "hikaricp.connections.pending",
    "hikaricp.connections.timeout",
    "hikaricp.connections.usage",
    "http.server.requests",
    "jdbc.connections.active",
    "jdbc.connections.idle",
    "jdbc.connections.max",
    "jdbc.connections.min",
    "jvm.buffer.count",
    "jvm.buffer.memory.used",
    "jvm.buffer.total.capacity",
    "jvm.classes.loaded",
    "jvm.classes.unloaded",
    "jvm.gc.live.data.size",
    "jvm.gc.max.data.size",
    "jvm.gc.memory.allocated",
    "jvm.gc.memory.promoted",
    "jvm.gc.pause",
    "jvm.memory.committed",
    "jvm.memory.max",
    "jvm.memory.used",
    "jvm.threads.daemon",
    "jvm.threads.live",
    "jvm.threads.peak",
    "jvm.threads.states",
    "logback.events",
    "process.cpu.usage",
    "process.files.max",
    "process.files.open",
    "process.start.time",
    "process.uptime",
    "system.cpu.count",
    "system.cpu.usage",
    "system.load.average.1m",
    "tomcat.sessions.active.current",
    "tomcat.sessions.active.max",
    "tomcat.sessions.alive.max",
    "tomcat.sessions.created",
    "tomcat.sessions.expired",
    "tomcat.sessions.rejected"
  ]
}