Monitoring
Traversal Report
Details about each traversal and synchronization errors can be examined in the History menu.
Click on Show Details to get information about each traversal and inspect the errors during synchronization.

Here you can find general information about the traversal, e.g. the mode and type of the traversal, along with the count of discovered items in the source system and the number of items indexed to the search engine. Detailed information about failed operations can be found in the button section of the page.
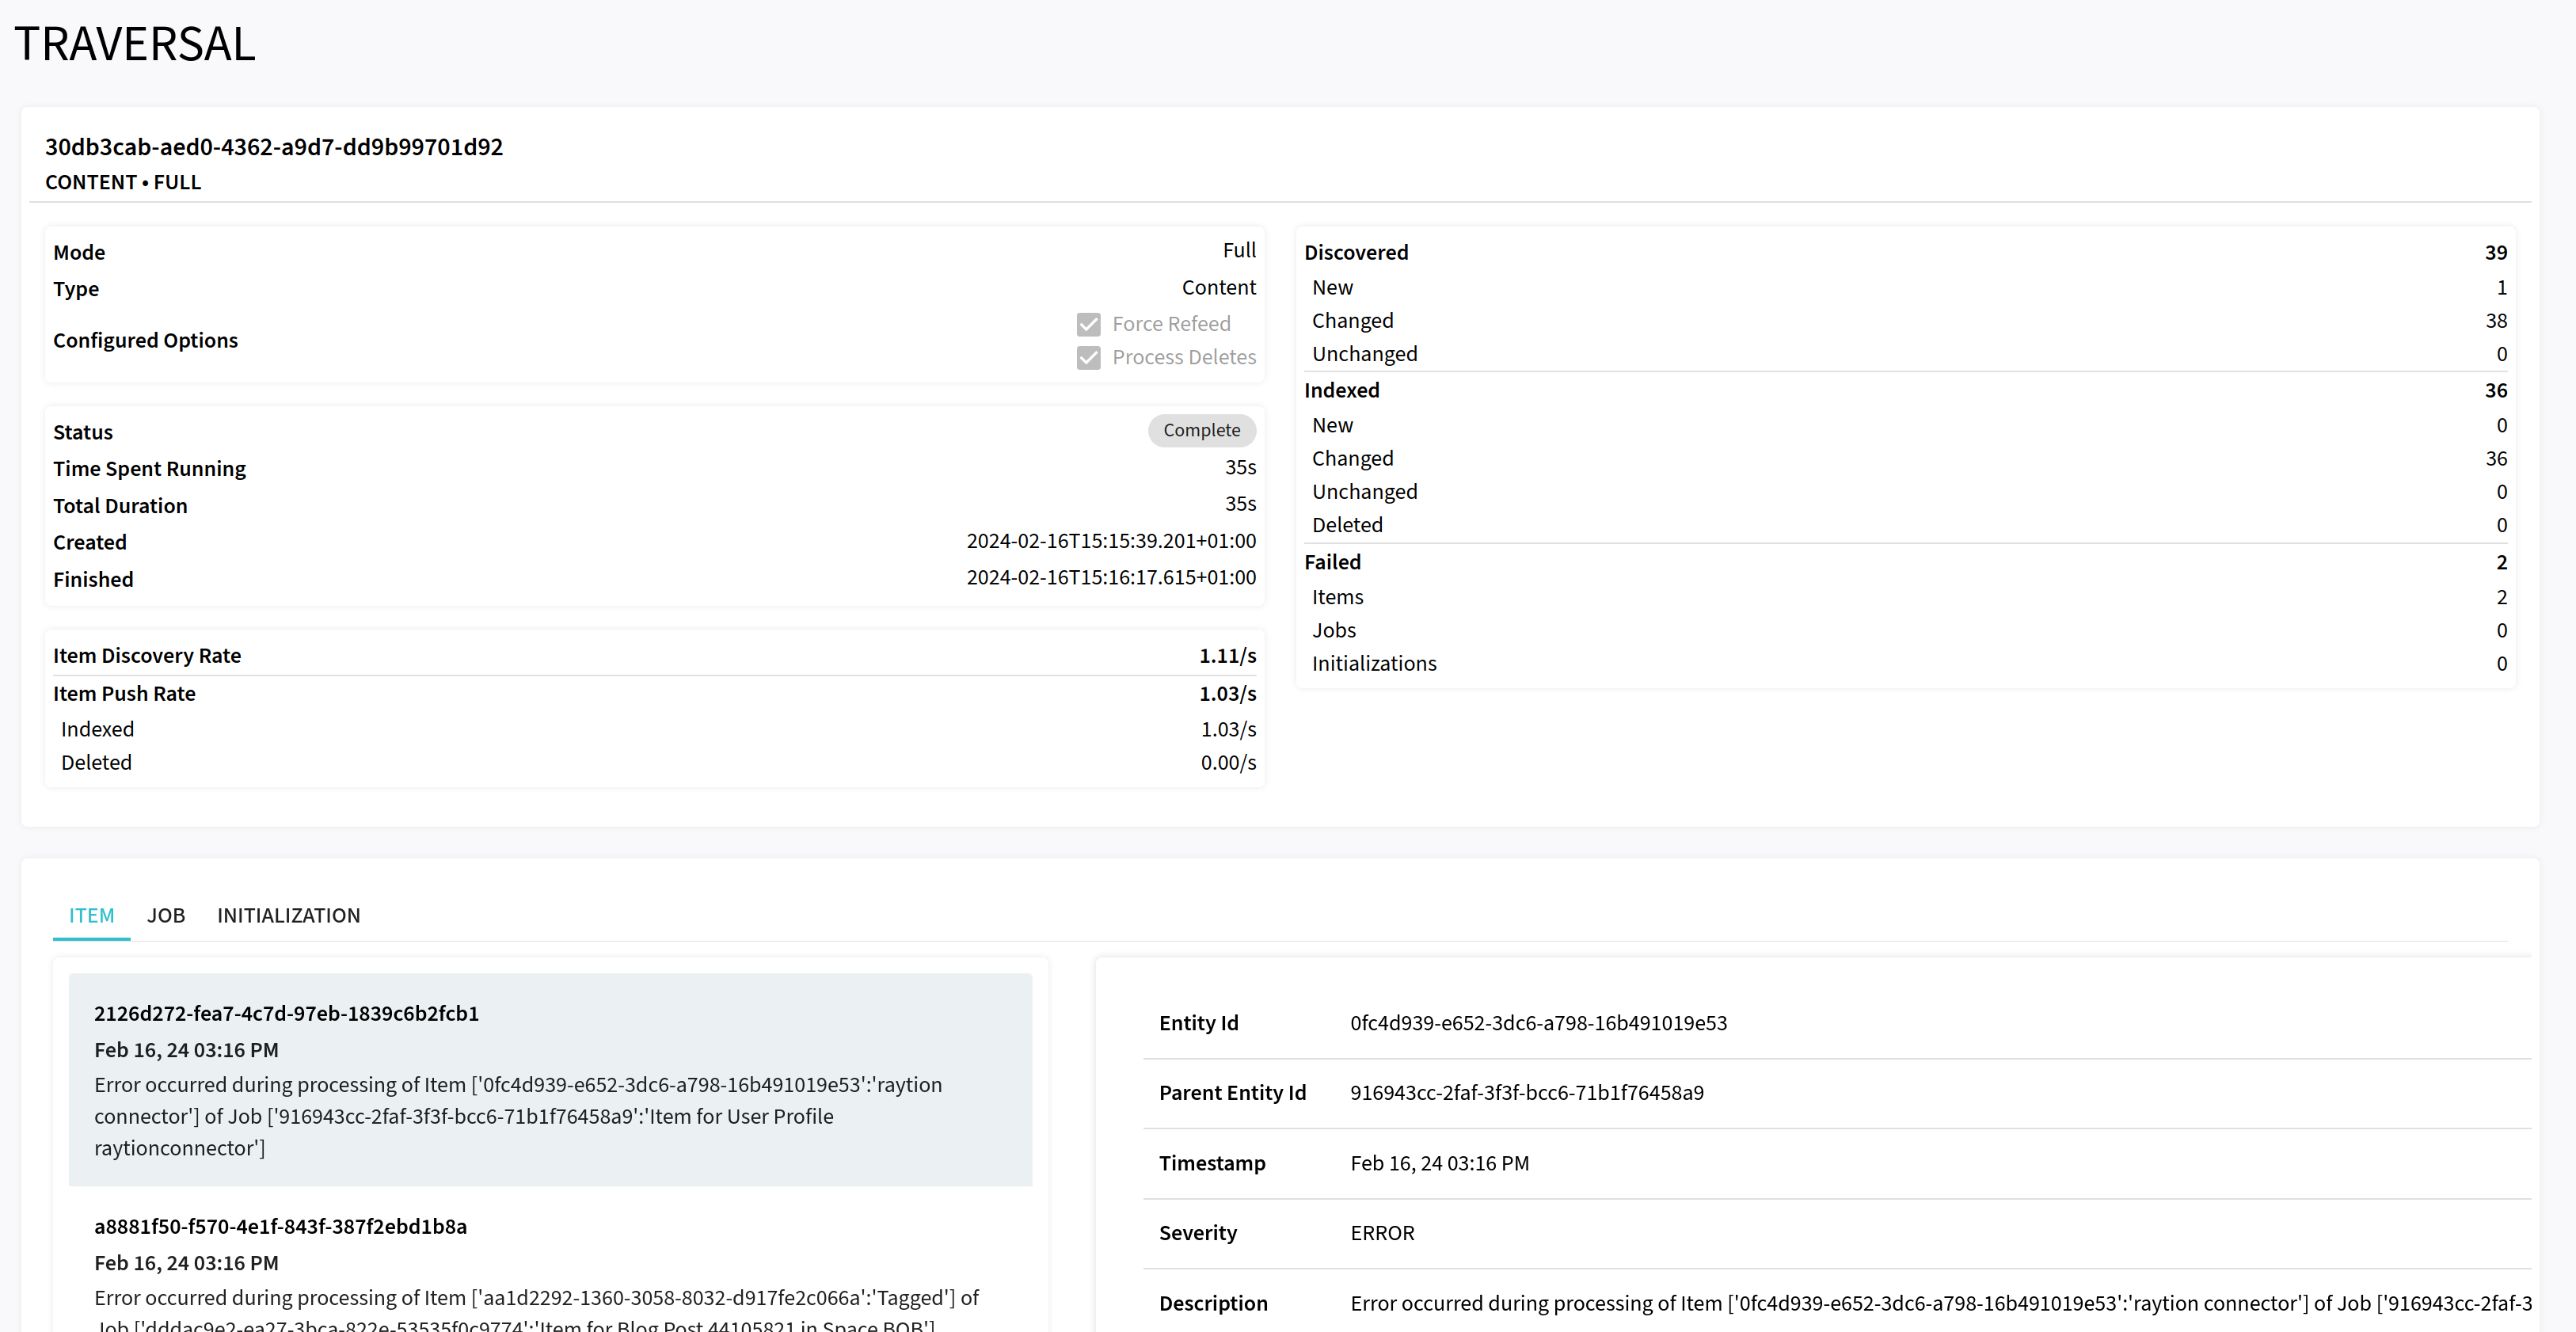
The errors are categorized into item-level, job-level and initialization errors. Each item-level error associates exactly a single item, while a job-level error and an initialization error associates a dynamic subset of items within the source system which could not be processed by the connector.
Logging
From the configuration validation on the Configuration page and the error reporting on the History page the Admin UI
should provide sufficient information to understand the state of your connector.
By default, logging is not accessible, because this would raise a security vulnerability.
But if necessary, to get more insight into system state, you can enable the logging endpoints for a connector product.
In order to view the logs in the Log Viewer of the Admin UI, you have to add the following to the application.properties file:
management.endpoint.logfile.enabled=trueIt is also possible to change the log levels of the different loggers if you activate the loggers endpoint with the following setting in the application.properties file:
management.endpoint.loggers.enabled=trueWhen the logfile endpoint is enabled, the logs can be also downloaded from the UI to share it with our Support Team.
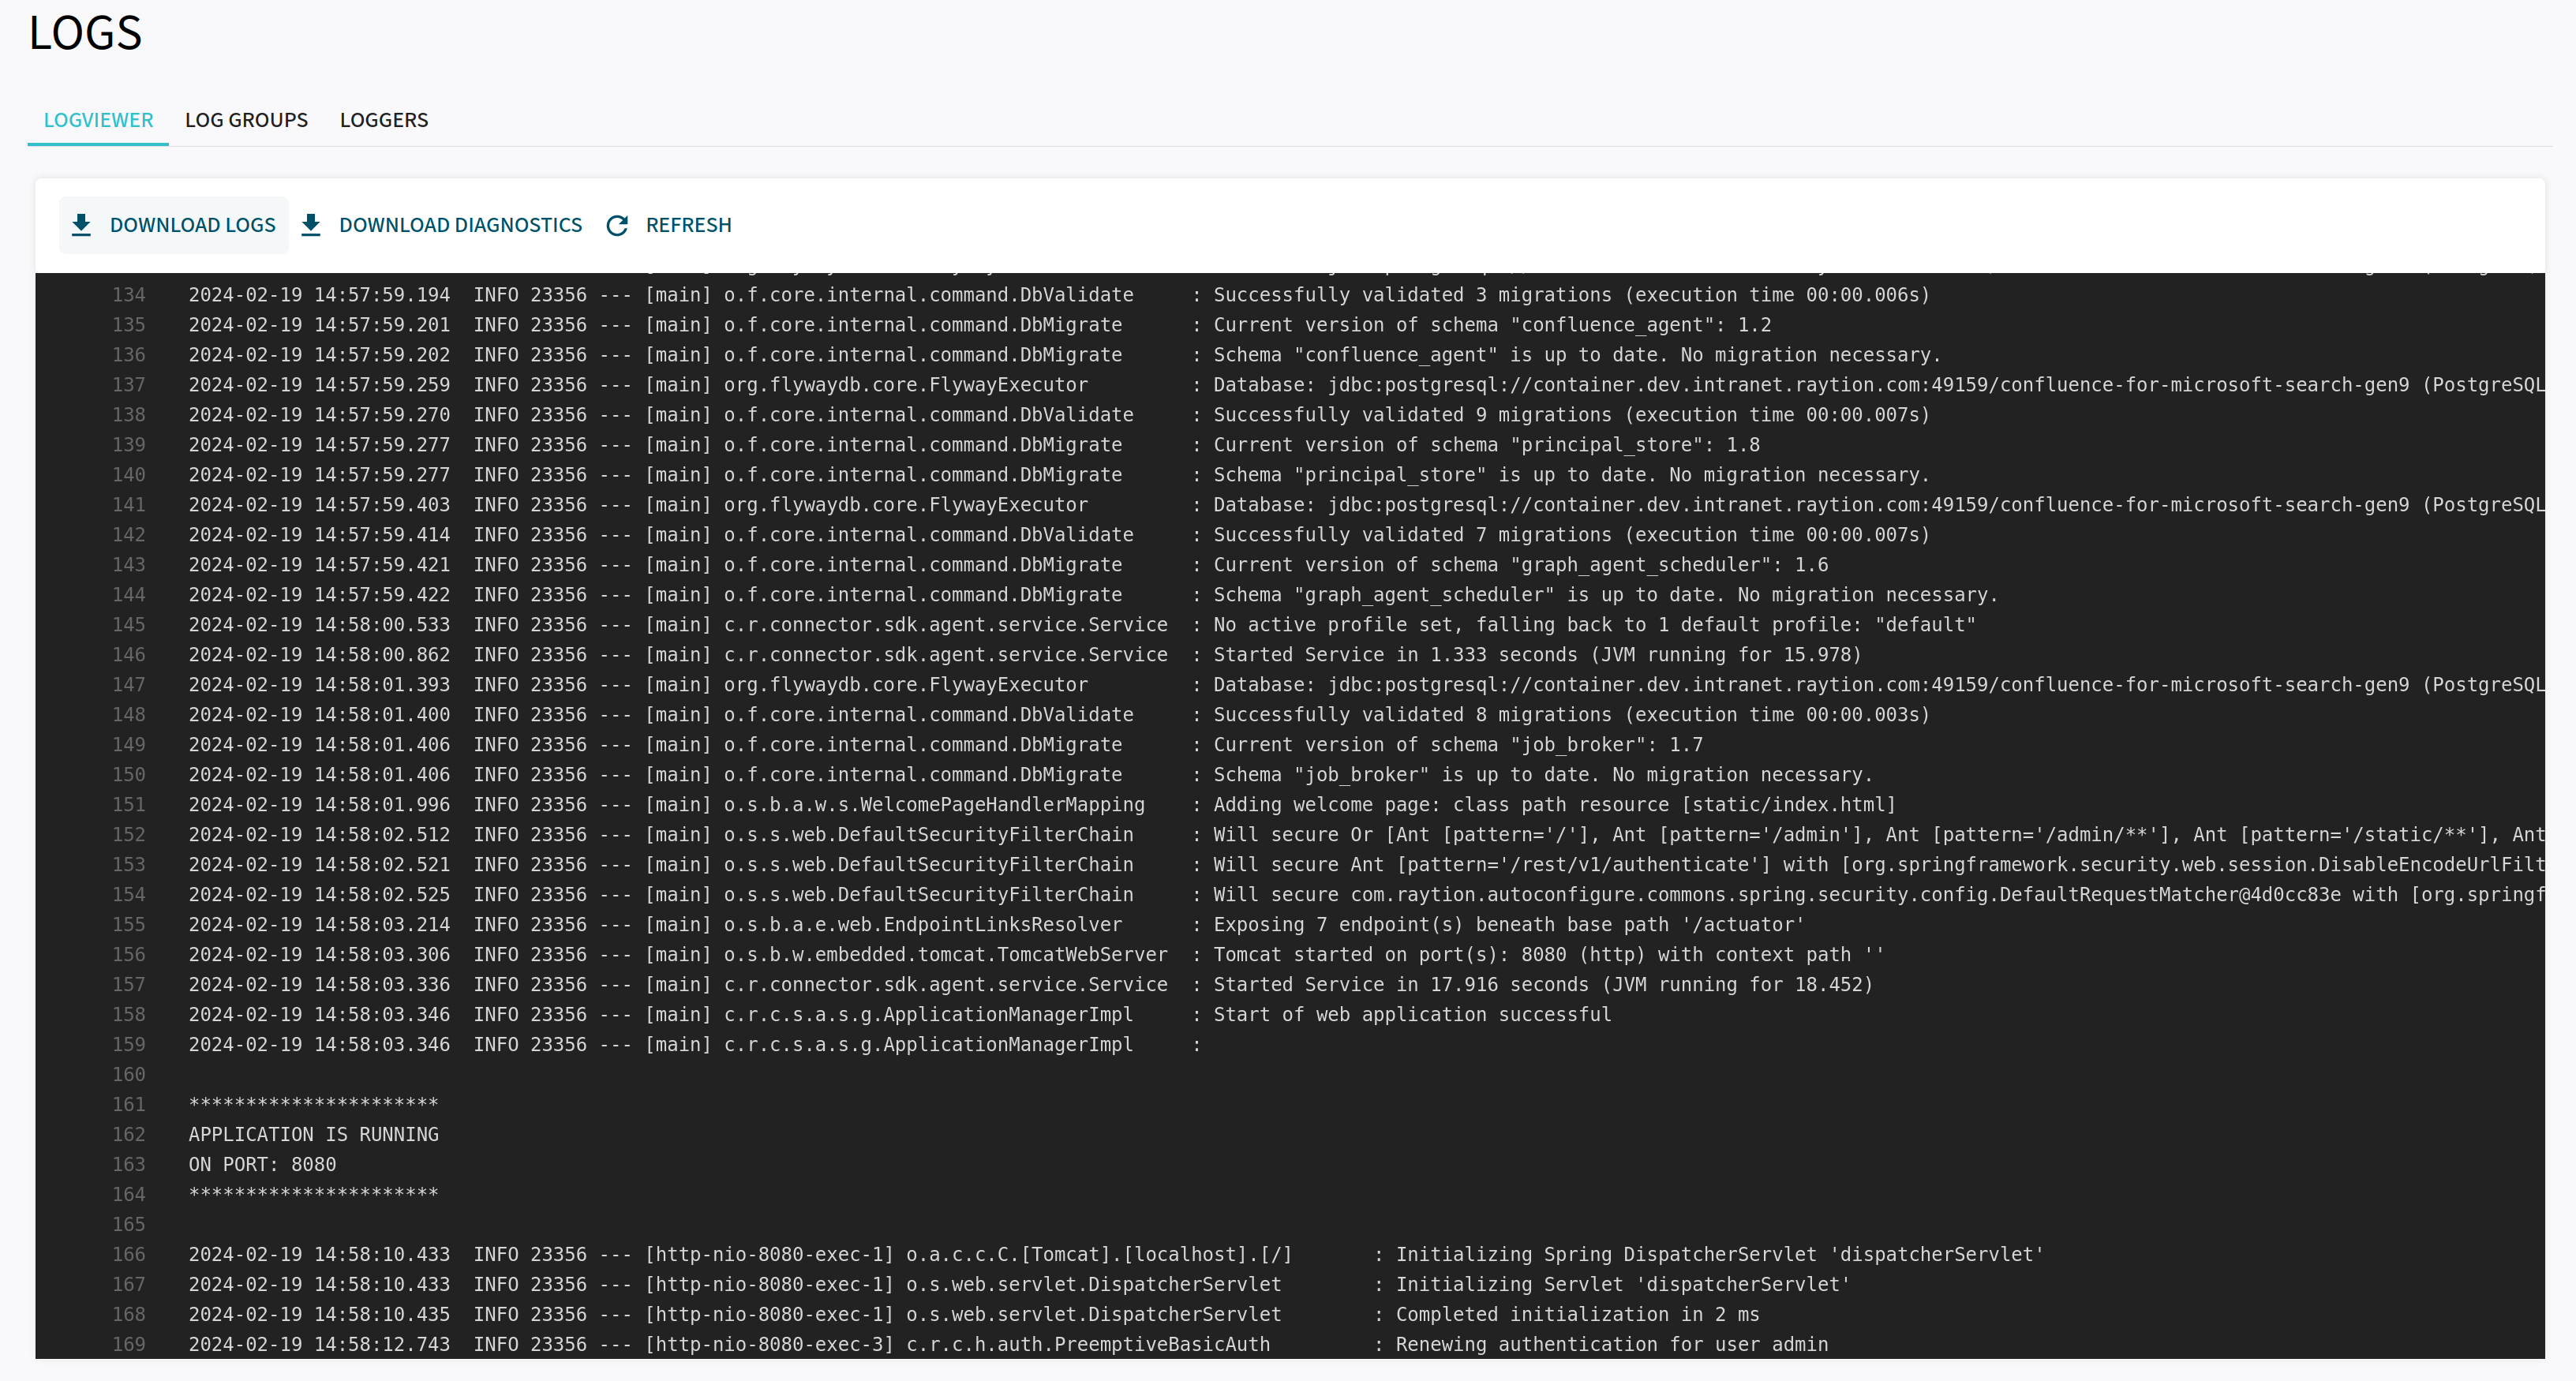
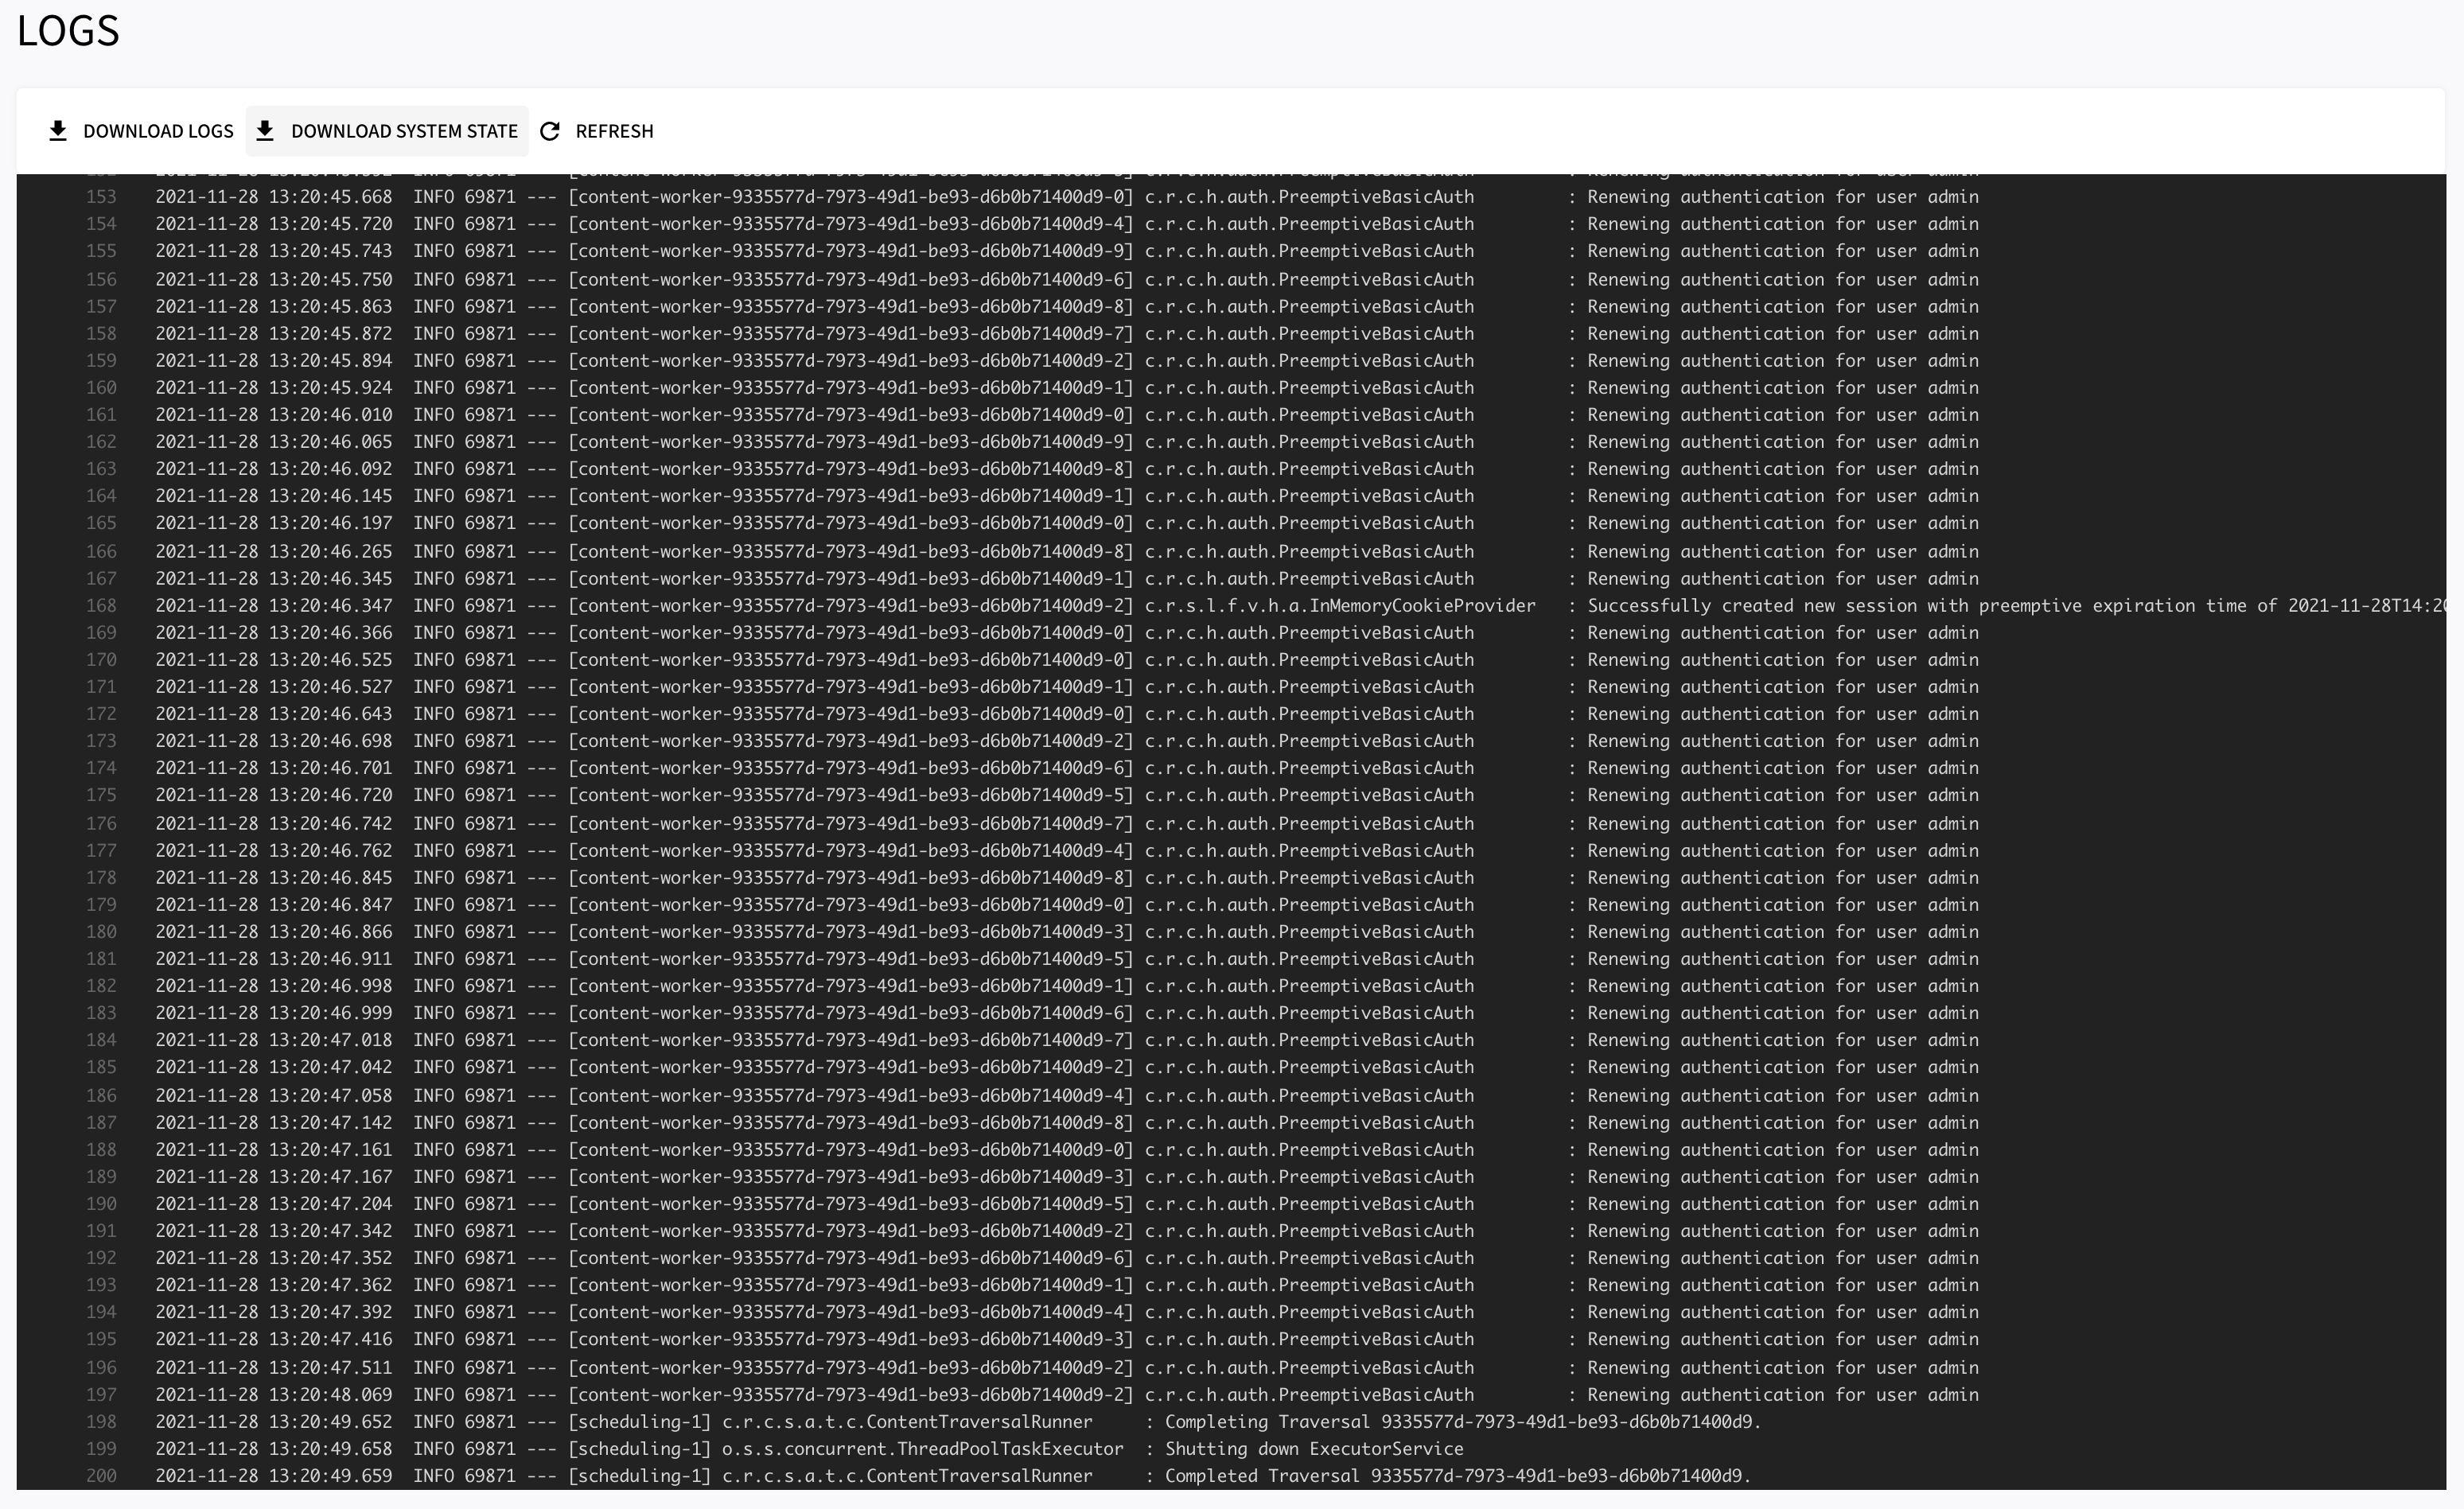
The logs can be retrieved and downloaded from the Logs menu.
For downloading the logs, click on DOWNLOAD LOGS under LOGVIEWER.
| Enabling the logging endpoints might expose sensitive information. |
Metrics
The Connector provides metrics which can be natively pulled by Prometheus. The current snapshot of the metrics can be downloaded
together with the System State, but to monitor the connector continuously and aggregate the metrics, we recommend
to deploy your own Prometheus instance.
To retrieve the list of available metrics, invoke the REST endpoint /actuator/metrics:
{
  "names": [
    "broker_channels_delete_duration",
    "broker_channels_deletes",
    "connector.traversal.items.backend.add",
    "connector.traversal.items.backend.delete",
    "connector.traversal.items.changed",
    "connector.traversal.items.children",
    "connector.traversal.items.create",
    "connector.traversal.items.delete",
    "connector.traversal.items.fail",
    "connector.traversal.items.getStatus",
    "connector.traversal.items.new",
    "connector.traversal.items.orphan",
    "connector.traversal.items.pipeline.process",
    "connector.traversal.items.put",
    "connector.traversal.items.unchanged",
    "connector.traversal.items.unseen",
    "connector.traversal.jobs.complete",
    "connector.traversal.jobs.fail",
    "connector.traversal.jobs.poll",
    "connector.traversal.jobs.put",
    "connector.traversal.nodes.content.process",
    "connector.traversal.partitions.children",
    "connector.traversal.partitions.delete",
    "connector.traversal.partitions.orphan",
    "connector.traversal.partitions.orphan.delete",
    "connector.traversal.partitions.put",
    "connector.traversal.partitions.unseen",
    "connector.traversal.workers.blocked",
    "connector.traversal.workers.lifetime",
    "connector.traversal.workers.new",
    "connector.traversal.workers.runnable",
    "connector.traversal.workers.terminated",
    "connector.traversal.workers.timed_waiting",
    "connector.traversal.workers.waiting",
    "hikaricp.connections",
    "hikaricp.connections.acquire",
    "hikaricp.connections.active",
    "hikaricp.connections.creation",
    "hikaricp.connections.idle",
    "hikaricp.connections.max",
    "hikaricp.connections.min",
    "hikaricp.connections.pending",
    "hikaricp.connections.timeout",
    "hikaricp.connections.usage",
    "http.server.requests",
    "jdbc.connections.active",
    "jdbc.connections.idle",
    "jdbc.connections.max",
    "jdbc.connections.min",
    "jvm.buffer.count",
    "jvm.buffer.memory.used",
    "jvm.buffer.total.capacity",
    "jvm.classes.loaded",
    "jvm.classes.unloaded",
    "jvm.gc.live.data.size",
    "jvm.gc.max.data.size",
    "jvm.gc.memory.allocated",
    "jvm.gc.memory.promoted",
    "jvm.gc.pause",
    "jvm.memory.committed",
    "jvm.memory.max",
    "jvm.memory.used",
    "jvm.threads.daemon",
    "jvm.threads.live",
    "jvm.threads.peak",
    "jvm.threads.states",
    "logback.events",
    "process.cpu.usage",
    "process.files.max",
    "process.files.open",
    "process.start.time",
    "process.uptime",
    "system.cpu.count",
    "system.cpu.usage",
    "system.load.average.1m",
    "tomcat.sessions.active.current",
    "tomcat.sessions.active.max",
    "tomcat.sessions.alive.max",
    "tomcat.sessions.created",
    "tomcat.sessions.expired",
    "tomcat.sessions.rejected"
  ]
}
Diagnostics
Detailed information about the connector, including its configuration, traversals
(such as history, errors or jobs), and runtime details,
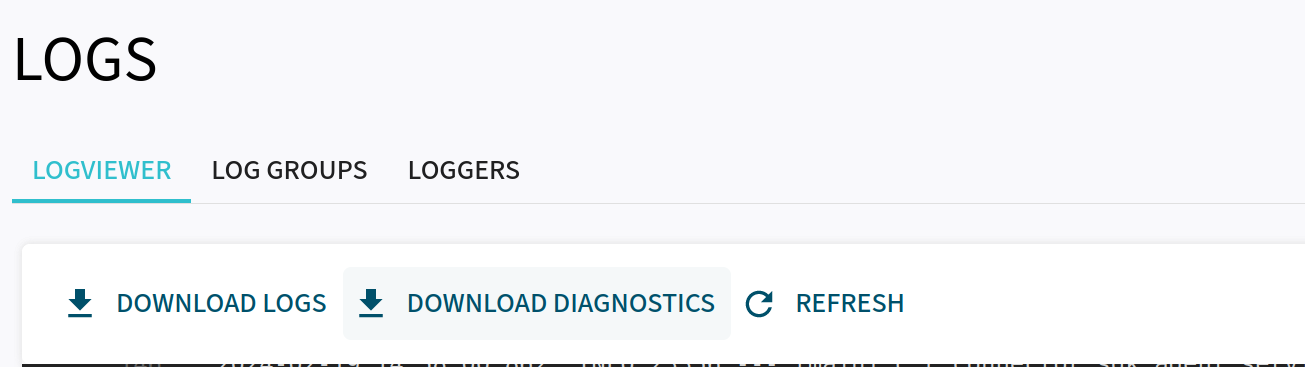
can be obtained from the Log Viewer using the DOWNLOAD DIAGNOSTICS option under LOGVIEWER.
Here you can also get information about the general system state
including a subset of aggregated metrics and thread dump under 'Runtime information'.
This option helps us to detect performance bottlenecks, among other things.
Upon selecting DOWNLOAD DIAGNOSTICS, you can choose the specific type of information you wish to download.
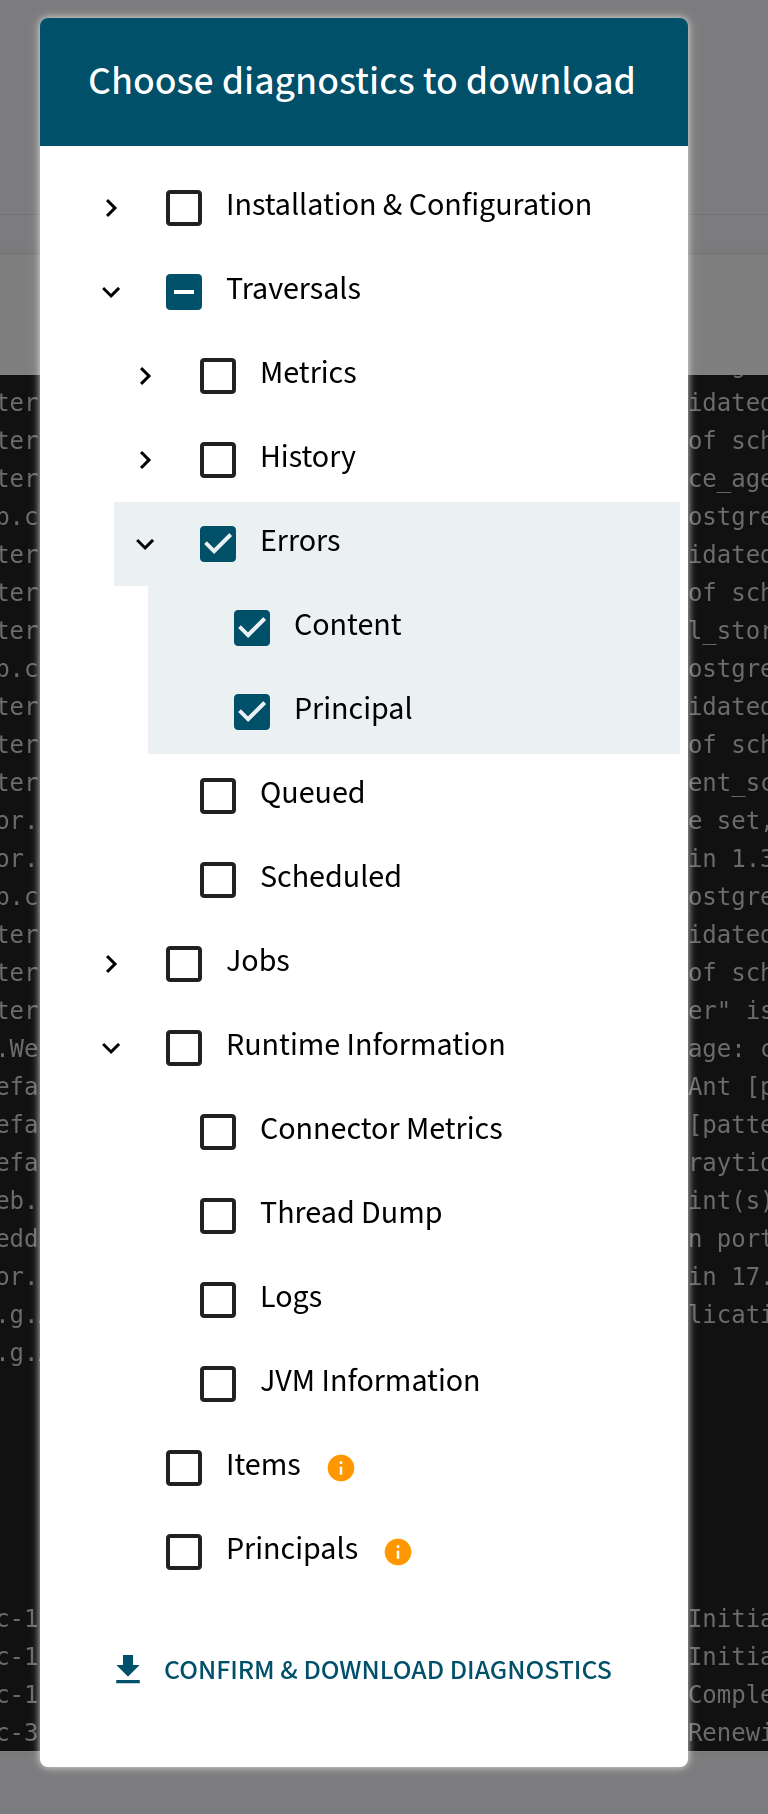
Once you have made your selection, click on CONFIRM & DOWNLOAD DIAGNOSTICS to proceed with the download.
Log Groups and Logger
To simplify the detection of errors, you can now group multiple loggers and simultaneously change their log level
directly in the Admin UI. To do this, navigate to the Logger LOG GROUP in the Logs menu.
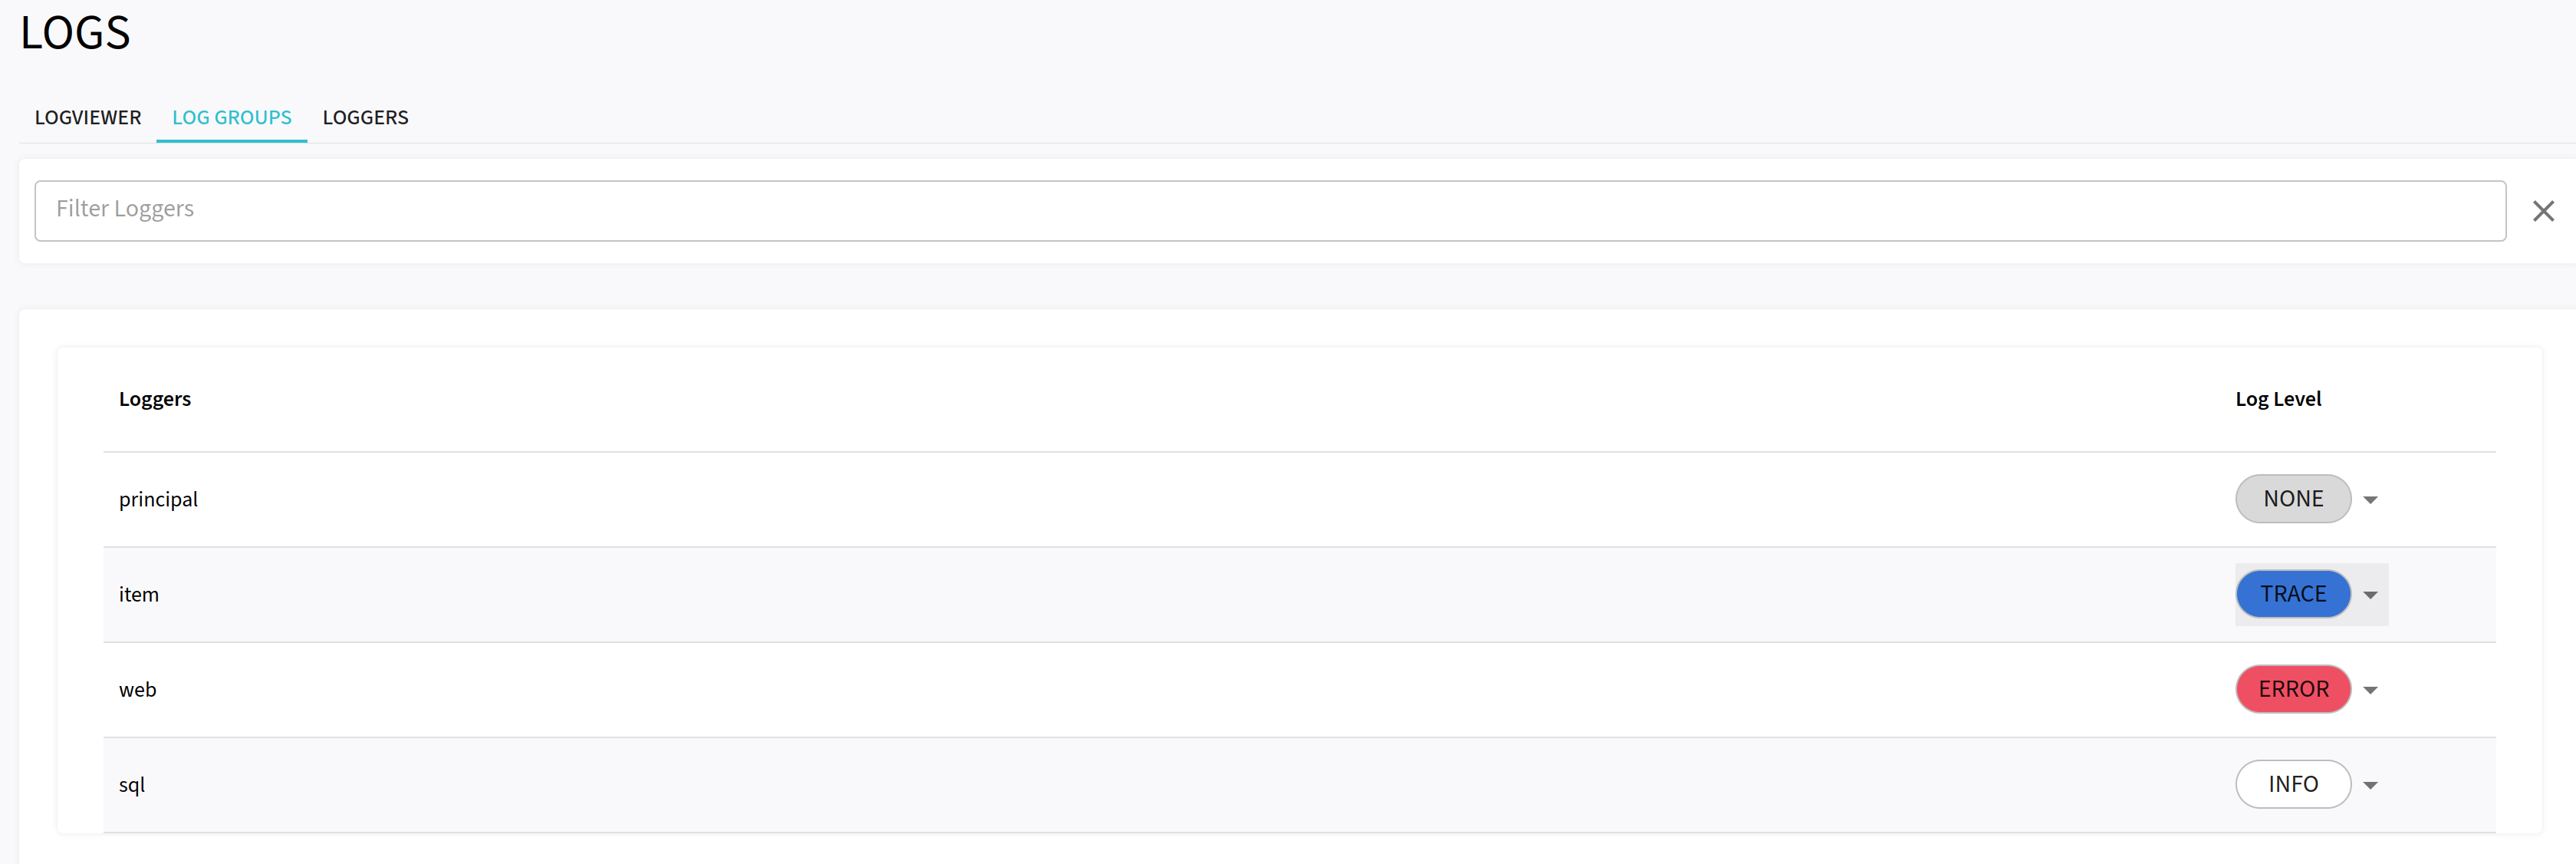
Four pre-defined log groups, namely item, principal, web, and SQL, are utilized to trace jobs related to items and principals, as well as to capture information regarding the database and web-based activities.
To adjust the log level, click on the log level located on the right side. A menu will appear, allowing you to choose the desired logging level.
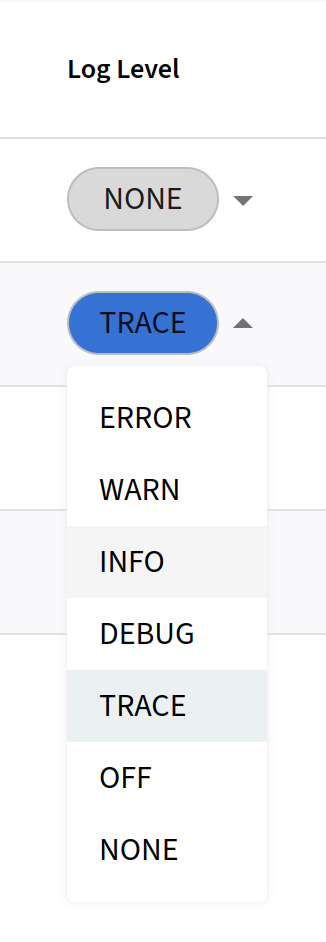
When configuring logger groups, you simultaneously change the logging levels for all packages associated with that group.
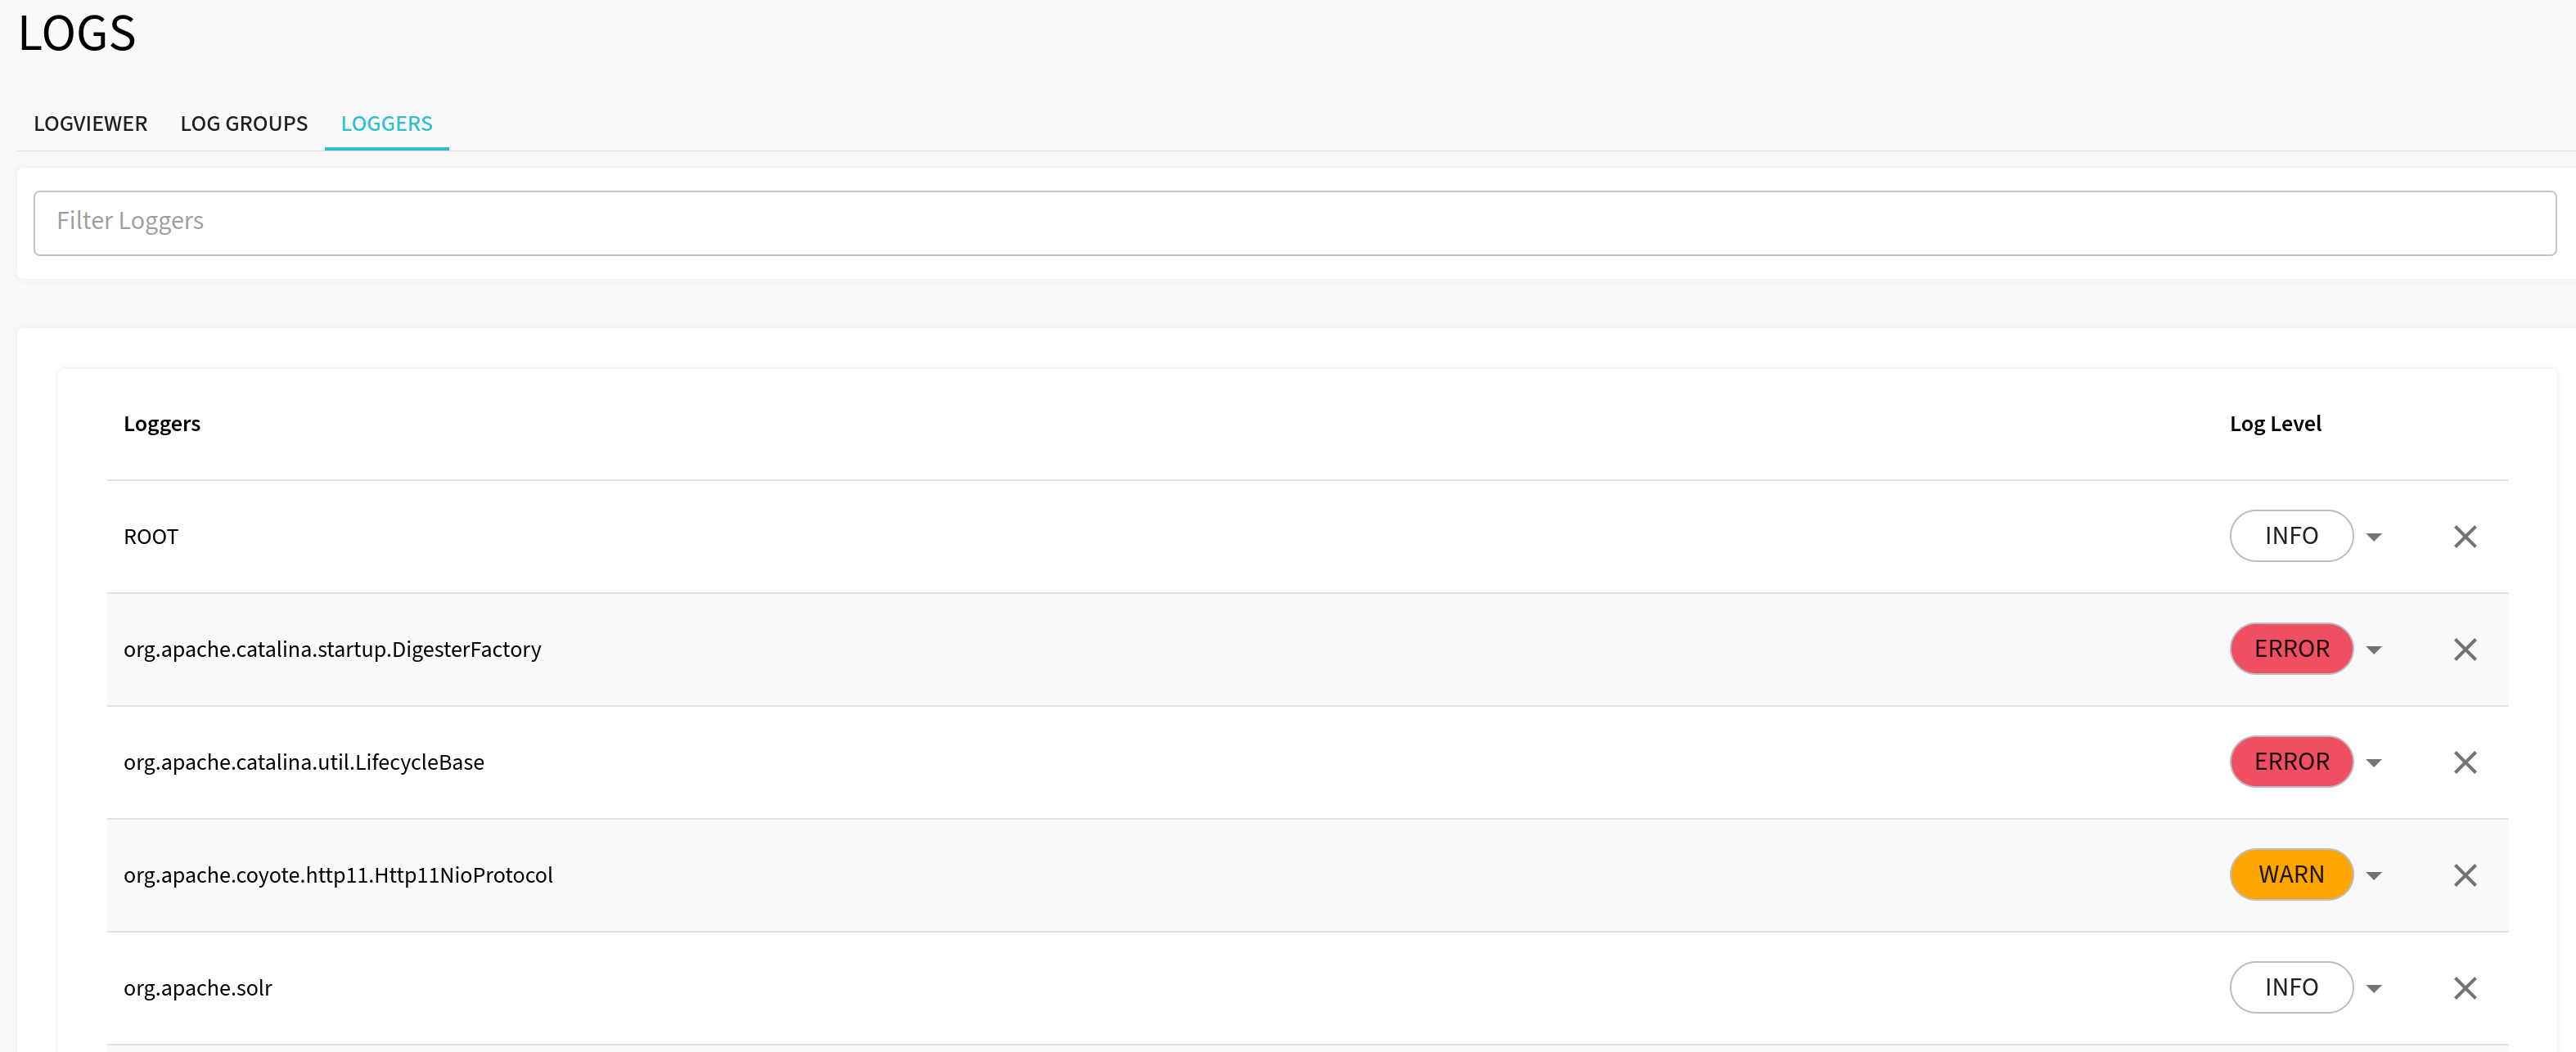
If you specifically want to adjust the logging level for an individual package, you can do so under LOGGERS in the Logs menu.
System Shutdown
The shutdown actuator endpoint provides a possibility to initiate the shutdown of the application via REST request. In order to avoid security vulnerability the endpoint is disabled by default. However it can be enabled by adding the following to the `application.properties file:
management.endpoint.shutdown.enabled=true